How to start with Selenium Debugging
By Pooja Deshpande, Community Contributor - February 6, 2023
Debugging is a very important feature when it comes to understanding the code, whether it be a developer, tester, or any technical person involved in coding. In many organizations today, automation frameworks are already designed, and debugging skills can help us to understand a framework effectively in a step-by-step manner.
Debugging helps in identifying failures and understanding the control flow in our code. It is a very effective way to understand the execution flow. Debugging also helps to understand the failures and find out the root cause of the failures in an effective way.
However, finding the right debugging technique is very important in order to reach the root cause of the failures. Let’s see different debugging techniques in Selenium.
Debugging in Selenium
There are multiple ways to debug Selenium code.
- Applying breakpoints
- Screenshots
- Session Logging
Breakpoints in Selenium
Let’s first understand what breakpoints are and how to use them while debugging.
Breakpoints in automation testing help us to halt execution at a particular point in our code. When you apply a breakpoint at some point in our code, it helps debug the code step by step from that point.
Let us see how to apply breakpoints and run our code in debug mode:
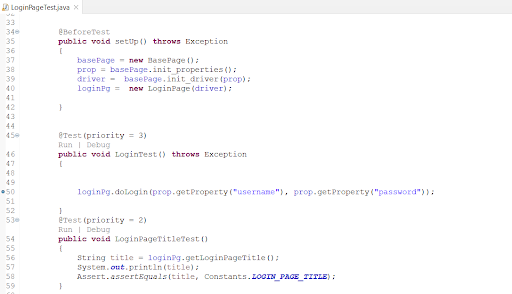
Step 1 Place the cursor on the line where you want to apply the breakpoint and press Ctrl+Shift+B. You can also double-click on the left-hand side of the eclipse editor window.
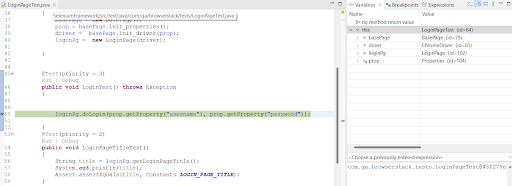
Here you can see the breakpoint is applied in line number 50.
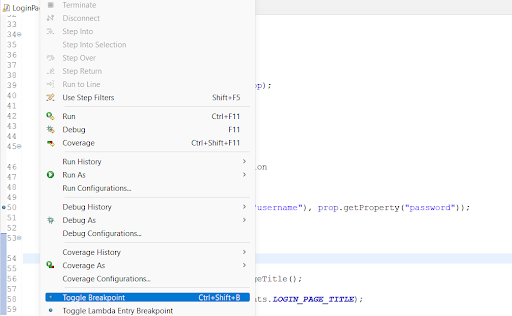
Step 2 You can place the breakpoint by navigating and selecting Run > Toggle Breakpoint in the Eclipse editor.
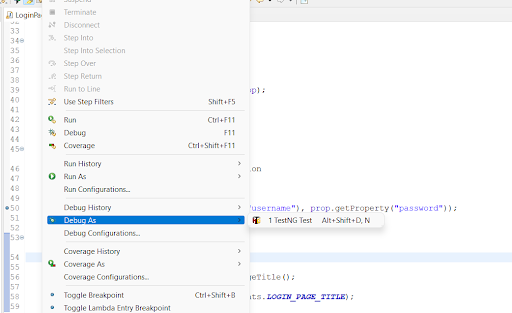
Step 3 After applying the breakpoint, you can now execute the code in debug mode by selecting Run > Debug As > TestNG test. Using TestNG in this example.
You can also right-click anywhere in the program and invoke the Debug as option.
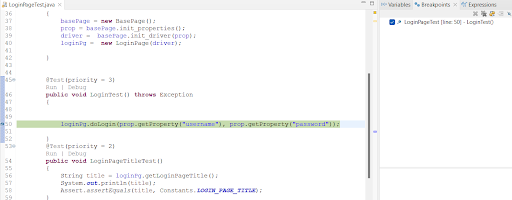
Step 4 After invoking the debug option, your code will start executing in debug mode, and execution will halt at the breakpoint you applied at line 50.
As you can see, the execution has halted at line 50, and it is highlighted in green. The breakpoints tab that is displayed at the right hand side of the image shows all the breakpoints applied.
Step 5 There is another “variables” tab that displays the values assigned to the variables during execution. You can also see the variable values changing as the execution flow goes from one line to another.
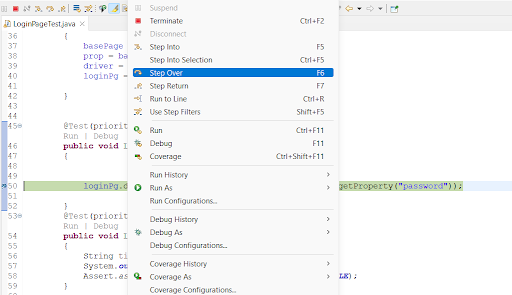
Step 6 Once the control has reached up to the breakpoint, You can execute a piece of code or method as a whole (not executing it step by step) by pressing F6 or Step over icon.
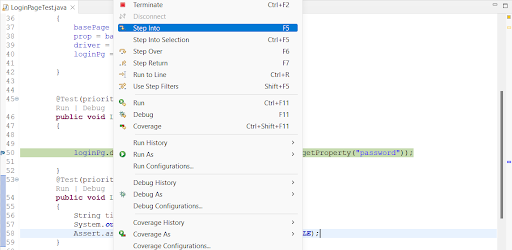
Step 7 You can also use the Step Into option to debug the code line by line.
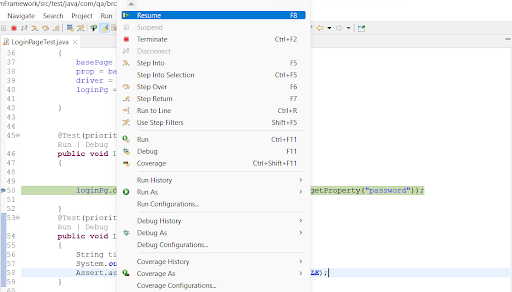
Step 8 You can stop the step-by-step execution and resume normal execution by pressing F8 or Resume.
Capturing Screenshots
Screenshots help us to understand how the test execution has progressed during the execution of test scripts. Selenium allows us to take screenshots during the execution of test scripts with the help of an interface called TakeScreenshot.
Must Read: How to take screenshots in Selenium
Let’s see how to use this interface with the help of the below example:
package screenshotsinselenium;

import java.io.File;

import org.apache.commons.io.FileUtils;

import org.openqa.selenium.OutputType;

import org.openqa.selenium.TakesScreenshot;

import org.openqa.selenium.WebDriver;

import org.openqa.selenium.chrome.ChromeDriver;

import org.testng.annotations.Test;

public class screenshotsexample {

@Test

public void testBStackTakeScreenShot() throws Exception{


WebDriver driver ;

System.setProperty("webdriver.chrome.driver","c:\\chromedriver.exe");

driver = new ChromeDriver();

driver.get("https://www.browserstack.com");


//calling the screenshot function

this.takeScreenShot(driver, "D://BSTest.png") ;

}


public static void takeScreenShot(WebDriver webdriver,String fileWithPath) throws Exception{


//1. We need to convert webdriver object to TakeScreenshot

TakesScreenshot scrShot =((TakesScreenshot)webdriver);


//2. Calling the method getScreenshotAs and specify the output type of screenshot.

File SourceFile=scrShot.getScreenshotAs(OutputType.FILE);


//3. Then move the screenshot to the destination path where we need to copy our file

File DestinationFile=new File(fileWithPath);


//4. copy the file

FileUtils.copyFile(SourceFile, DestinationFile);

}

}
Session Logging
As the automation suite grows in size, the number of failures also may grow, and hence it becomes difficult to debug these failures or monitor the entire test execution. At this point, session recording can help us to record the entire session of execution and save it for future reference. Session recording helps to record the screen states, screen transitions during execution, inputs to different tests, etc.
This might help for a detailed understanding of execution flow and locate exact points of failures. These recordings can also be given as execution evidence to developers and other stakeholders. Selenium does not provide direct support for session recording, but you can integrate it with a third-party tool called Monte Media Library.
Debugging on Real Devices
Debugging on real devices helps to understand and debug the application’s behaviour in real user conditions. BrowserStack offers a real device cloud platform. You can access over 3000+ different device, browsers, and OS combinations using this platform. There are different use cases when the test results alter in dev environment and in real user conditions, which is why it is recommended to test on real devices for accurate test results.
It helps deliver seamless and consistent user experience across different device-browser-OS combinations under real world conditions. You can run same tests on multiple device-browser combinations saving time and ensuring maximum test coverage.
